
Statistics
Statistics Overview
Business intelligence and analytics for your prop firm
Statistics Overview
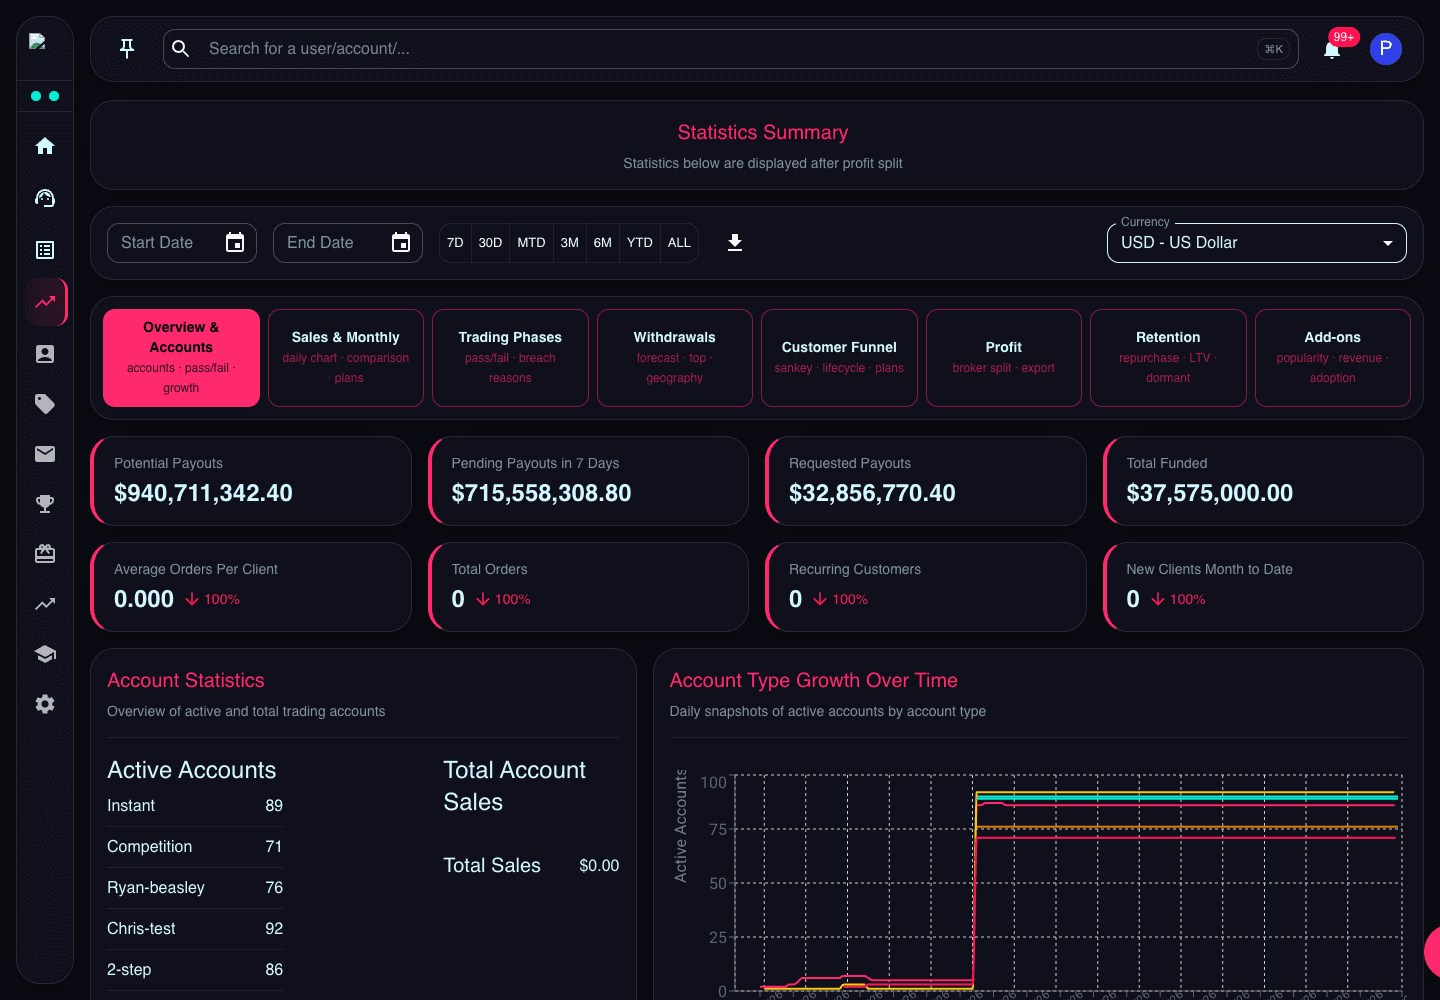
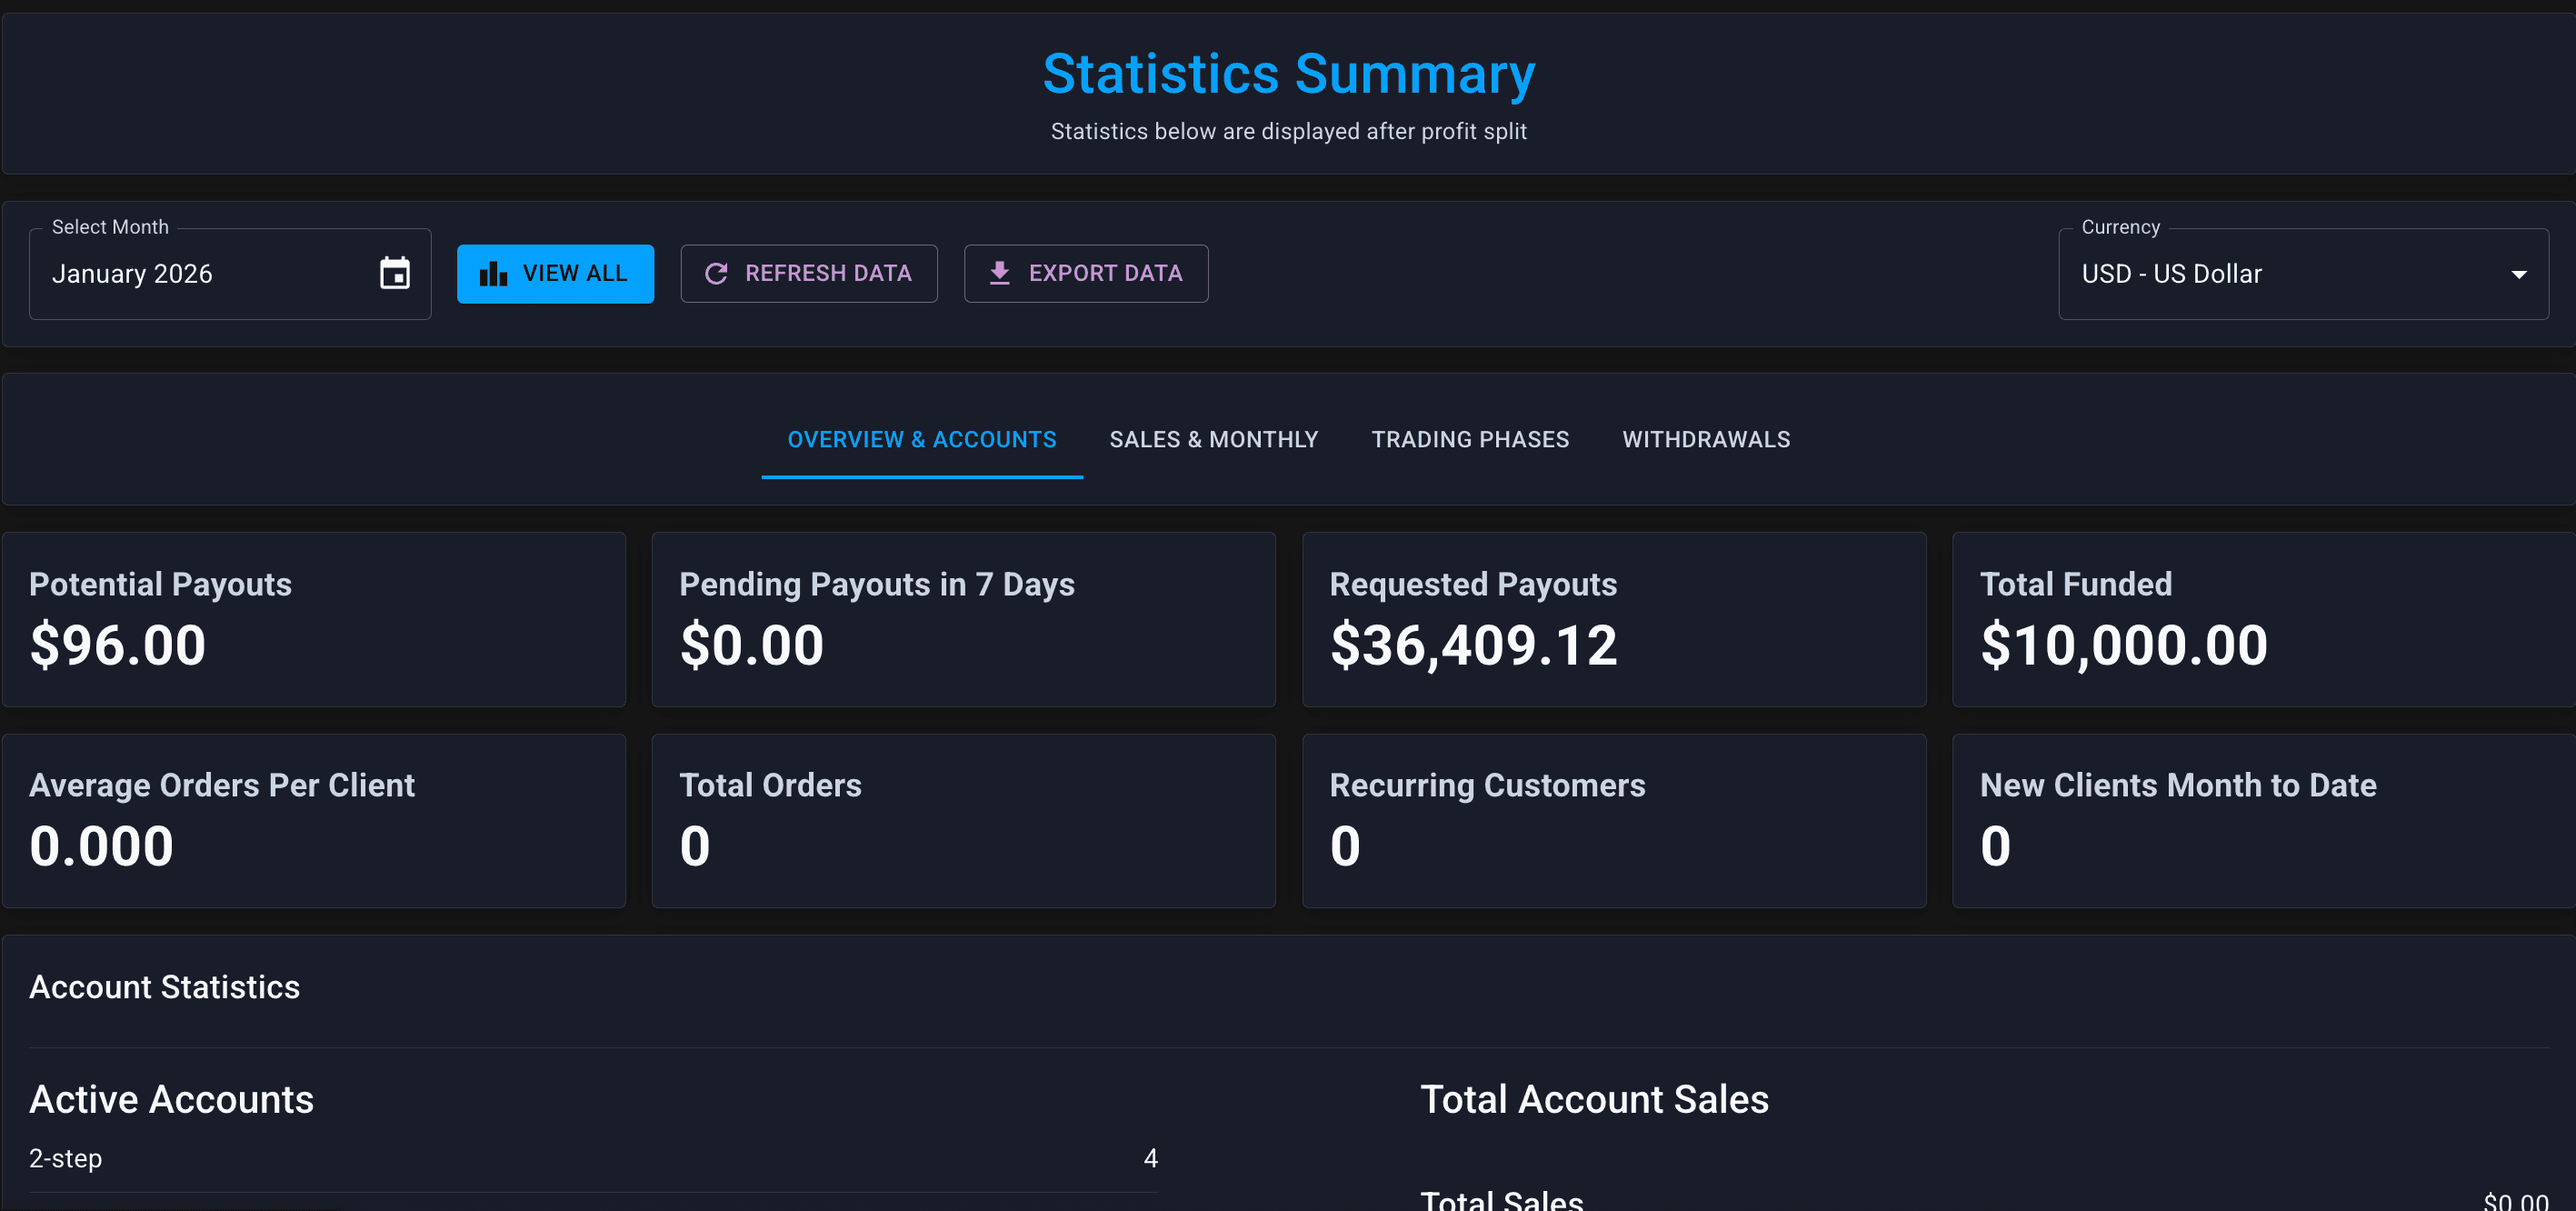
The Statistics page is your business intelligence dashboard — sales performance, trader success rates, payout analysis, and forecasting.
Sales & Revenue
Trader Performance
Pass/Fail Rates by Phase
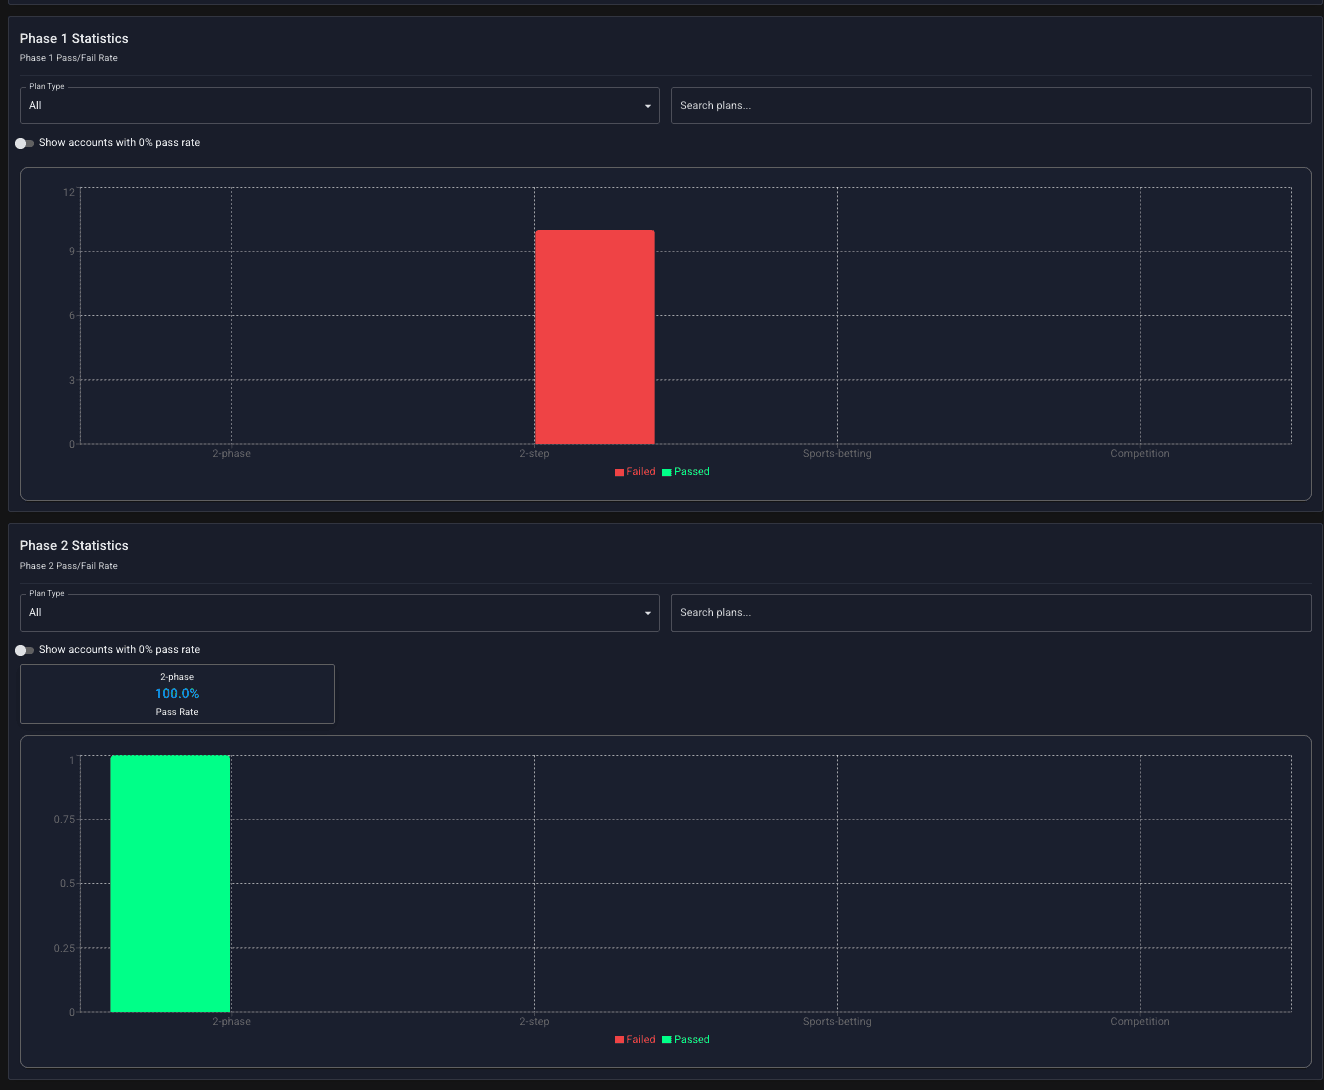
This is crucial for calibrating your challenges.
| Rate | What It Might Mean |
|---|---|
| Very high pass rate (>30%) | Challenges too easy → unsustainable payouts |
| Very low pass rate (<5%) | Challenges too hard → bad reputation, refunds |
| Balanced rate (10-20%) | Sweet spot → profitable and achievable |
Rough industry benchmarks:
- Phase 1: 10-20% pass rate
- Phase 2: 30-50% of those who passed Phase 1
- Overall to funded: 5-15%
Your optimal rates depend on your business model and pricing.
Pass/Fail by Day
Trend analysis over time.
Sudden changes might indicate:
- Market conditions (volatile markets = more failures)
- Rule changes taking effect
- Influx of different trader types (from marketing)
- A bug or misconfiguration
Plan Fail Rates
Which specific plans have the highest failure rates?
High fail rate on one plan might mean:
- Rules are too strict for that plan
- Product attracts wrong type of trader
- Need better education/onboarding for that product
Payout Analysis
Forecasting
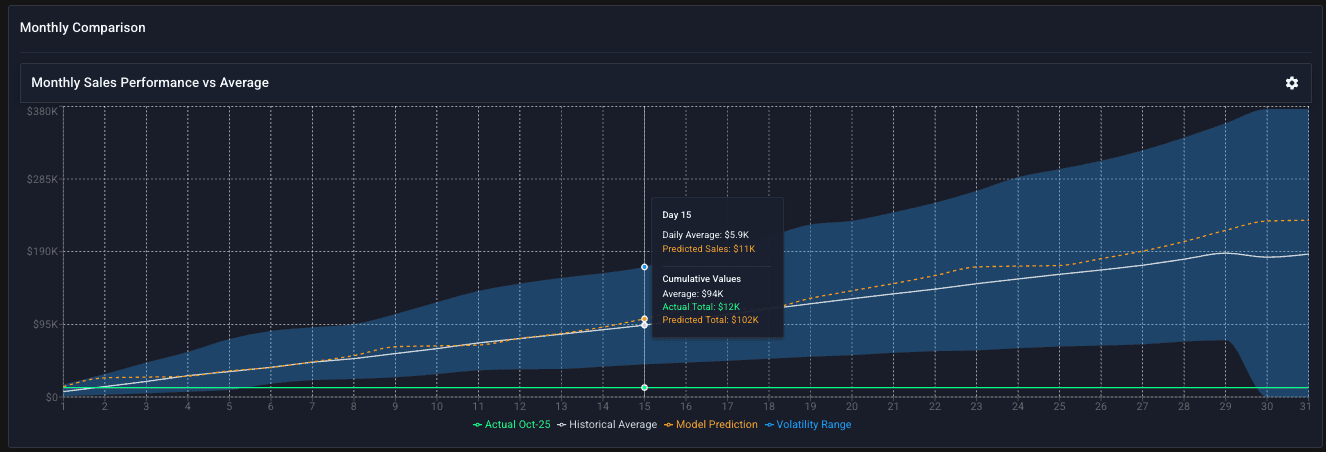
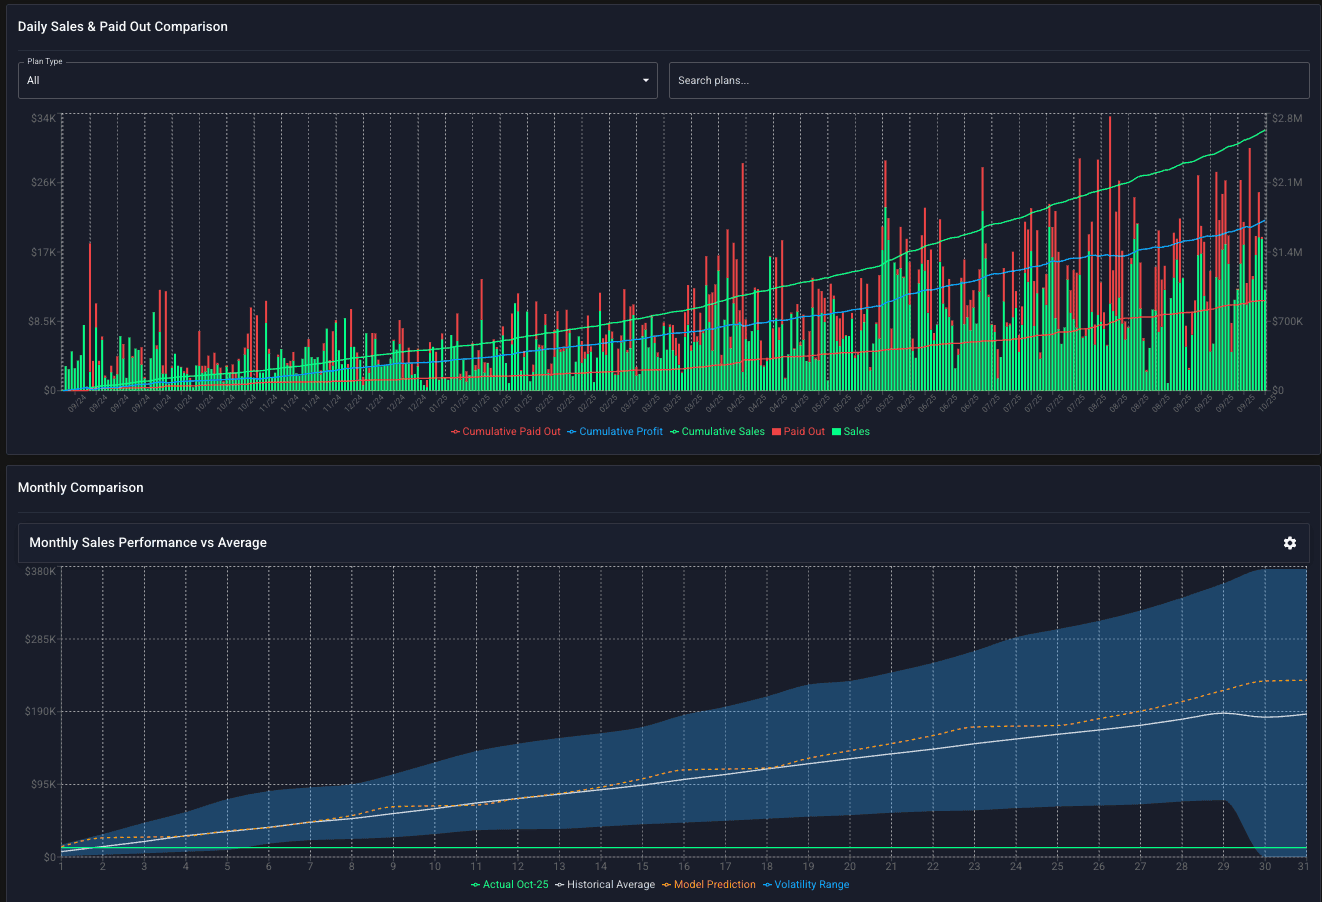
Predicted Sales
Based on historical patterns, what revenue can you expect?
Use for:
- Cash flow planning
- Marketing budget decisions
- Growth projections and planning
- Investor reporting
Using Statistics Effectively
Daily Glance (1 minute)
- Check today's sales — anything unusual?
- Any spike in failure rates?
Weekly Review (15 minutes)
- Pass rate trends — challenges calibrated correctly?
- Payout liability vs revenue — healthy margin?
- Top performers — anyone building big profits?
- Geographic breakdown — any shifts?
Monthly Analysis (1 hour)
- Full country breakdown and regional performance
- Plan-by-plan comparison
- Forecast vs actual — were predictions accurate?
- Pricing and product decisions based on data
If pass rates suddenly spike, investigate immediately. Could indicate:
- A rule misconfiguration letting everyone through
- An exploit being shared in trading communities
- Market conditions making targets unrealistically easy
- A bug in the tracking system